
Introduction
Temperature anomalies and percentiles are shown on the gridded maps below. The anomaly map on the left is a product of a merged land surface temperature (Global Historical Climatology Network, GHCN) and sea surface temperature (ERSST.v4) anomaly analysis as described in Huang et al. (2016). Temperature anomalies for land and ocean are analyzed separately and then merged to form the global analysis. For more information, please visit NCEI's Global Surface Temperature Anomalies page. The percentile map on the right provides additional information by placing the temperature anomaly observed for a specific place and time period into historical perspective, showing how the most current month, season or year compares with the past.
Temperatures
In the atmosphere, 500-millibar height pressure anomalies correlate well with temperatures at the Earth's surface. The average position of the upper-level ridges of high pressure and troughs of low pressure—depicted by positive and negative 500-millibar height anomalies on the  December 2016 and
  October–December 2016 maps—is generally reflected by areas of positive and negative temperature anomalies at the surface, respectively.
December

The combined average temperature over global land and ocean surfaces for December 2016 was the third highest for this month in the 137-year period of record, at 0.79°C (1.42°F) above the 20th century average of 12.2°C (54.0°F). However, this value falls well short of the record high December temperature, 1.12°C (2.02°F) above average, which was set in 2015. The second warmest December was in 2014, making these last three Decembers the three warmest on record.
The average global temperature across land surfaces was 1.28°C (2.30°F) above the 20th century average of 3.7°C (38.7°F)—the sixth highest December global land temperature on record. This value also falls well short of the record high December land temperature—also set last year—by 0.60°C (1.10°F).
Warmer- to much-warmer-than-average conditions were present across much of the world's land surfaces, with record warmth across southern Mexico, parts of central and southern Africa, and areas across southern and southeastern Asia, according to the Land & Ocean Temperature Percentiles map above. According to NCEI's Global Regional analysis, the African continent as a whole was second warmest, behind only 2009, and South America was third warmest for the month. Cooler-than-average and much-cooler-than-average conditions were observed across the northwest quarter of the contiguous United States into southwestern Canada, eastern Europe into southwestern Asia, and a large section of northwestern Russia, where temperatures dipped to more than 5°C (9°F) below their average December values in places. No land areas experienced record cold temperatures during December 2016.
Select national information is highlighted below. Please note that different countries report anomalies with respect to different base periods. The information provided here is based directly upon these data:
- Norway ended 2016 on a warm note, with the December temperature 4.6°C (8.3°F) above its 1961–1990 national average, making this one of the 10 warmest Decembers in the country's 117-year period of record. Some regions in northern Norway and the higher elevations of eastern Norway were record warm, with temperatures as much as 6°–7°C (11°–13°F) above their monthly averages.
- Denmark observed its sixth warmest December (tied with 1951) in the country's 143-year record, at 3.3°C (5.9°F) above the 1961–1990 average and 1.9°C (3.4°F) above the average of the last decade (2006–2015). In terms of absolute temperatures, December was warmer than November, the first such occurrence since 1988.
- The United Kingdom reported its eighth warmest December in a series dating to 1910, with a monthly temperature 2.0°C (3.6°F) higher than the 1981–2010 average. Parts of Scotland observed temperatures more than 3°C (5°F) above normal.
- Iceland was also warm in December, with most stations reporting anomalies that ranked among their four warmest for the month, with some stations record warm, including Teigarhorn, which has a record dating to 1872. The capital city of Reykjavik had its fourth warmest December, at 3.8°C (6.8°F) warmer than its 1961–1990 average and 3.2°C (5.8°F) warmer than the average of the past decade (2006–2015).
- In Argentina, December was extremely warm around Buenos Aires and northeastern Patagonia, particularly along the Atlantic coast. The city of Mar del Plata had 14 days with temperatures rising above 30°C (86°F), three of which surpassed 35°C (95°F). This high number of heat days ranks second behind the record of December 2013.
- The average temperature for Australia in December 2016 was 0.71°C (1.28°F) above the 1961–1990 average. Much of the warmth was due to high overnight temperatures, reported to be 0.96°C (1.73°F) above average, the seventh highest such value in the record dating to 1910. The average maximum temperature was also above average, but by a lesser margin of 0.46°C (0.83°F). Regionally, New South Wales had its second warmest December on record, while Queensland had its third.
For the oceans, the December globally-averaged sea surface temperature was 0.61°C (1.10°F) above the 20th century average of 15.7°C (60.4°F), the fourth highest for December on record, behind the record warmth of 2015 by 0.23°C (0.41°F). December 2009 and December 2014 were also warmer than this month, ranking second and third warmest, respectively.
Most of the world's oceans experienced warmer- to much-warmer-than-average temperatures during December 2016, with record warmth present across regions of the Norwegian and Barents Seas in the Arctic, sections of the central Atlantic, parts of the northwestern Indian Ocean along the east African coast, and a few small areas scattered across various regions of the Pacific. Cooler-than-average conditions were observed in much of the northeastern and northwestern Pacific, part of the South Pacific well west of Chile, the North Atlantic waters to the south of Greenland, and regions of the Indian Ocean off coastal western Australia. No record cold sea surface temperatures were present during December.
La Niña conditions prevailed throughout December as sea surface temperatures remained below average across the eastern and central tropical Pacific Ocean. According to NOAA's Climate Prediction Center, a transition to ENSO-neutral is expected to occur by February 2017, with ENSO-neutral then continuing through the first half of the year. This forecast focuses on the ocean surface temperatures between 5°N and 5°S latitude and 170°W to 120°W longitude, called the Niño 3.4 region.
| December | Anomaly | Rank (out of 137 years) | Records | ||||
|---|---|---|---|---|---|---|---|
| °C | °F | Year(s) | °C | °F | |||
| Global | |||||||
| Land | +1.28 ± 0.11 | +2.30 ± 0.20 | Warmest | 6th | 2015 | +1.88 | +3.38 |
| Coolest | 132nd | 1929 | -1.31 | -2.36 | |||
| Ocean | +0.61 ± 0.15 | +1.10 ± 0.27 | Warmest | 4th | 2015 | +0.84 | +1.51 |
| Coolest | 134th | 1910 | -0.48 | -0.86 | |||
| Land and Ocean | +0.79 ± 0.14 | +1.42 ± 0.25 | Warmest | 3rd | 2015 | +1.12 | +2.02 |
| Coolest | 135th | 1916 | -0.57 | -1.03 | |||
| Northern Hemisphere | |||||||
| Land | +1.33 ± 0.11 | +2.39 ± 0.20 | Warmest | 8th | 2015 | +2.06 | +3.71 |
| Coolest | 130th | 1929 | -1.62 | -2.92 | |||
| Ocean | +0.70 ± 0.15 | +1.26 ± 0.27 | Warmest | 3rd | 2015 | +0.97 | +1.75 |
| Coolest | 135th | 1892, 1910 | -0.46 | -0.83 | |||
| Land and Ocean | +0.94 ± 0.13 | +1.69 ± 0.23 | Warmest | 4th | 2015 | +1.38 | +2.48 |
| Coolest | 134th | 1917 | -0.74 | -1.33 | |||
| Ties: 2003 | |||||||
| Southern Hemisphere | |||||||
| Land | +1.13 ± 0.12 | +2.03 ± 0.22 | Warmest | 2nd | 2015 | +1.41 | +2.54 |
| Coolest | 136th | 1903 | -0.84 | -1.51 | |||
| Ocean | +0.55 ± 0.15 | +0.99 ± 0.27 | Warmest | 5th | 2015 | +0.75 | +1.35 |
| Coolest | 133rd | 1910 | -0.50 | -0.90 | |||
| Land and Ocean | +0.64 ± 0.14 | +1.15 ± 0.25 | Warmest | 4th | 2015 | +0.85 | +1.53 |
| Coolest | 134th | 1909, 1910 | -0.52 | -0.94 | |||
| Arctic | |||||||
| Land and Ocean | +1.44 ± 0.56 | +2.59 ± 1.01 | Warmest | 17th | 2006 | +2.76 | +4.97 |
| Coolest | 121st | 1916 | -2.72 | -4.90 | |||
The most current data can be accessed via the Global Surface Temperature Anomalies page.
Year-to-date (January–December)

The  January–December map of temperature anomalies shows that higher-than-average temperatures occurred across the vast majority of the globe during 2016, combining to bring overall record warmth for 2016, with an annually averaged temperature that was 0.94°C (1.69°F) above the 20th century average. This surpasses the previous record set just last year by 0.04°C (0.07°F). The global temperatures were majorly influenced by strong El Niño conditions at the beginning of the year that weakened and dissipated in the spring, and, to a lesser extent, by weak La Niña conditions that developed later in the fall.
Please refer to the NCEI State of the Climate Annual Global Analysis report for more detailed information.
| January–December | Anomaly | Rank (out of 137 years) | Records | ||||
|---|---|---|---|---|---|---|---|
| °C | °F | Year(s) | °C | °F | |||
| Global | |||||||
| Land | +1.43 ± 0.15 | +2.57 ± 0.27 | Warmest | 1st | 2016 | +1.43 | +2.57 |
| Coolest | 137th | 1907 | -0.59 | -1.06 | |||
| Ocean | +0.75 ± 0.16 | +1.35 ± 0.29 | Warmest | 1st | 2016 | +0.75 | +1.35 |
| Coolest | 137th | 1909 | -0.45 | -0.81 | |||
| Land and Ocean | +0.94 ± 0.15 | +1.69 ± 0.27 | Warmest | 1st | 2016 | +0.94 | +1.69 |
| Coolest | 137th | 1908 | -0.44 | -0.79 | |||
| Northern Hemisphere | |||||||
| Land | +1.57 ± 0.17 | +2.83 ± 0.31 | Warmest | 1st | 2016 | +1.57 | +2.83 |
| Coolest | 137th | 1884 | -0.68 | -1.22 | |||
| Ocean | +0.86 ± 0.16 | +1.55 ± 0.29 | Warmest | 2nd | 2015 | +0.88 | +1.58 |
| Coolest | 136th | 1908, 1909 | -0.47 | -0.85 | |||
| Land and Ocean | +1.13 ± 0.15 | +2.03 ± 0.27 | Warmest | 1st | 2016 | +1.13 | +2.03 |
| Coolest | 137th | 1908 | -0.46 | -0.83 | |||
| Southern Hemisphere | |||||||
| Land | +1.07 ± 0.12 | +1.93 ± 0.22 | Warmest | 2nd | 2015 | +1.09 | +1.96 |
| Coolest | 136th | 1917 | -0.64 | -1.15 | |||
| Ocean | +0.69 ± 0.16 | +1.24 ± 0.29 | Warmest | 1st | 2016 | +0.69 | +1.24 |
| Coolest | 137th | 1911 | -0.43 | -0.77 | |||
| Land and Ocean | +0.75 ± 0.15 | +1.35 ± 0.27 | Warmest | 1st | 2016 | +0.75 | +1.35 |
| Coolest | 137th | 1911 | -0.45 | -0.81 | |||
| Arctic | |||||||
| Land and Ocean | +2.06 ± 0.12 | +3.71 ± 0.22 | Warmest | 1st | 2016 | +2.06 | +3.71 |
| Coolest | 137th | 1902 | -1.22 | -2.20 | |||

The most current data can be accessed via the Global Surface Temperature Anomalies page.
Precipitation
December
The maps below represent precipitation percent of normal (left, using a base period of 1961–1990) and precipitation percentiles (right, using the period of record) based on the GHCN dataset of land surface stations. As is typical, precipitation anomalies during December 2016 varied significantly around the world.
Select national information is highlighted below. (Please note that different countries report anomalies with respect to different base periods. The information provided here is based directly upon these data):
- In addition to its December warmth, Norway was wet. The country reported precipitation that was 150 percent of its national average for the month. Northern Norway received 250–300 percent of average precitation. Conversely, several stations in eastern Norway reported monthly precipitation totals that were less than 25 percent of their average.
- Record sunshine contributed to the driest December across Austria, where precipitation records date back to 1851. Some areas south of the main Alpine peak from East Tyrol to southern Burgenland had little to no rainfall. The wettest place relative to average was Puchberg, where precipitation was just 62 percent of its December average.
- France was also record dry during December, with average precipitation totals only 20 percent of its 1991–2010 average, breaking the previous record low of December 2015. National precipitation records date to 1959.
- Iceland was wet during December, particularly in the northwest and parts of the east coast. Reykjavic observed precipitation that was 190 percent of its normal ofr the month.
- Averaged across the country, Australia was also wet during December, with precipitation totals the fifth highest in the 117-year national record, at 176 percent of the 1961–1990 normal. South Australia was record wet for the month, at 271 percent of its average, while the Northern Territory and Western Australia each received their third highest December totals.
Ocean Heat Content
Ocean Heat Content (OHC) is essential for understanding and modeling global climate since > 90% of excess heat in the Earth's system is absorbed by the ocean. Further, expansion due to increased ocean heat contributes to sea level rise. Change in OHC is calculated from the difference of observed temperature profiles from the long-term mean.
| Basin | 0-700 meters | Rank (1955-2023) | |||||
|---|---|---|---|---|---|---|
| Entire Basin | Northern Hemisphere | Southern Hemisphere | ||||
| Atlantic | 5.614 | 10th | 3.360 | 11th | 2.254 | 11th |
| Indian | 3.311 | 14th | 0.828 | 3rd | 2.482 | 14th |
| Pacific | 5.333 | 8th | 2.473 | 11th | 2.859 | 8th |
| World | 14.275 | 9th | 6.680 | 8th | 7.596 | 11th |
| Source: Basin time series of heat content | ||||||

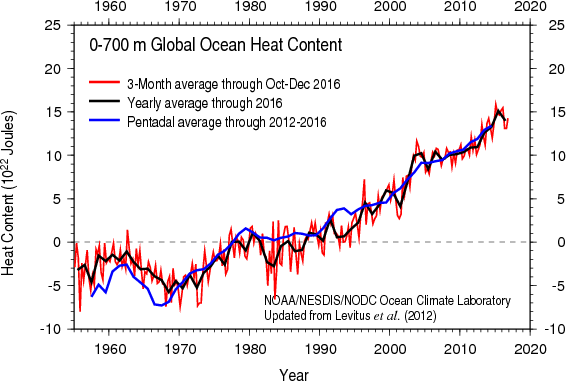
Global ocean heat content (OHC) for October–December 2016 was slightly lower than for the same quarter in 2015, but still the second highest October–December OHC on record. Although ocean surface temperatures were highest in 2016, the global OHC was lower than in 2015. Overall, the latest OHC reveals widespread warmer than normal conditions. In particular, the Arctic Ocean, the Gulf Stream/North Atlantic Current, the Kuroshio Current/Kuroshio Extension, and the Agulhas Current and its retroflection show much higher than long-term mean OHC. Cooler than normal conditions still exist in the central North Pacific Ocean and subpolar North Atlantic Ocean, around the Equator in the central Pacific Ocean, and tropical and western South Indian Ocean.
References
- Peterson, T.C. and R.S. Vose, 1997: An Overview of the Global Historical Climatology Network Database. Bull. Amer. Meteorol. Soc., 78, 2837-2849.
- Huang, B., V.F. Banzon, E. Freeman, J. Lawrimore, W. Liu, T.C. Peterson, T.M. Smith, P.W. Thorne, S.D. Woodruff, and H-M. Zhang, 2016: Extended Reconstructed Sea Surface Temperature Version 4 (ERSST.v4). Part I: Upgrades and Intercomparisons. J. Climate, 28, 911-930.