
NCEI’s Global Historical Climatology Network hourly data released

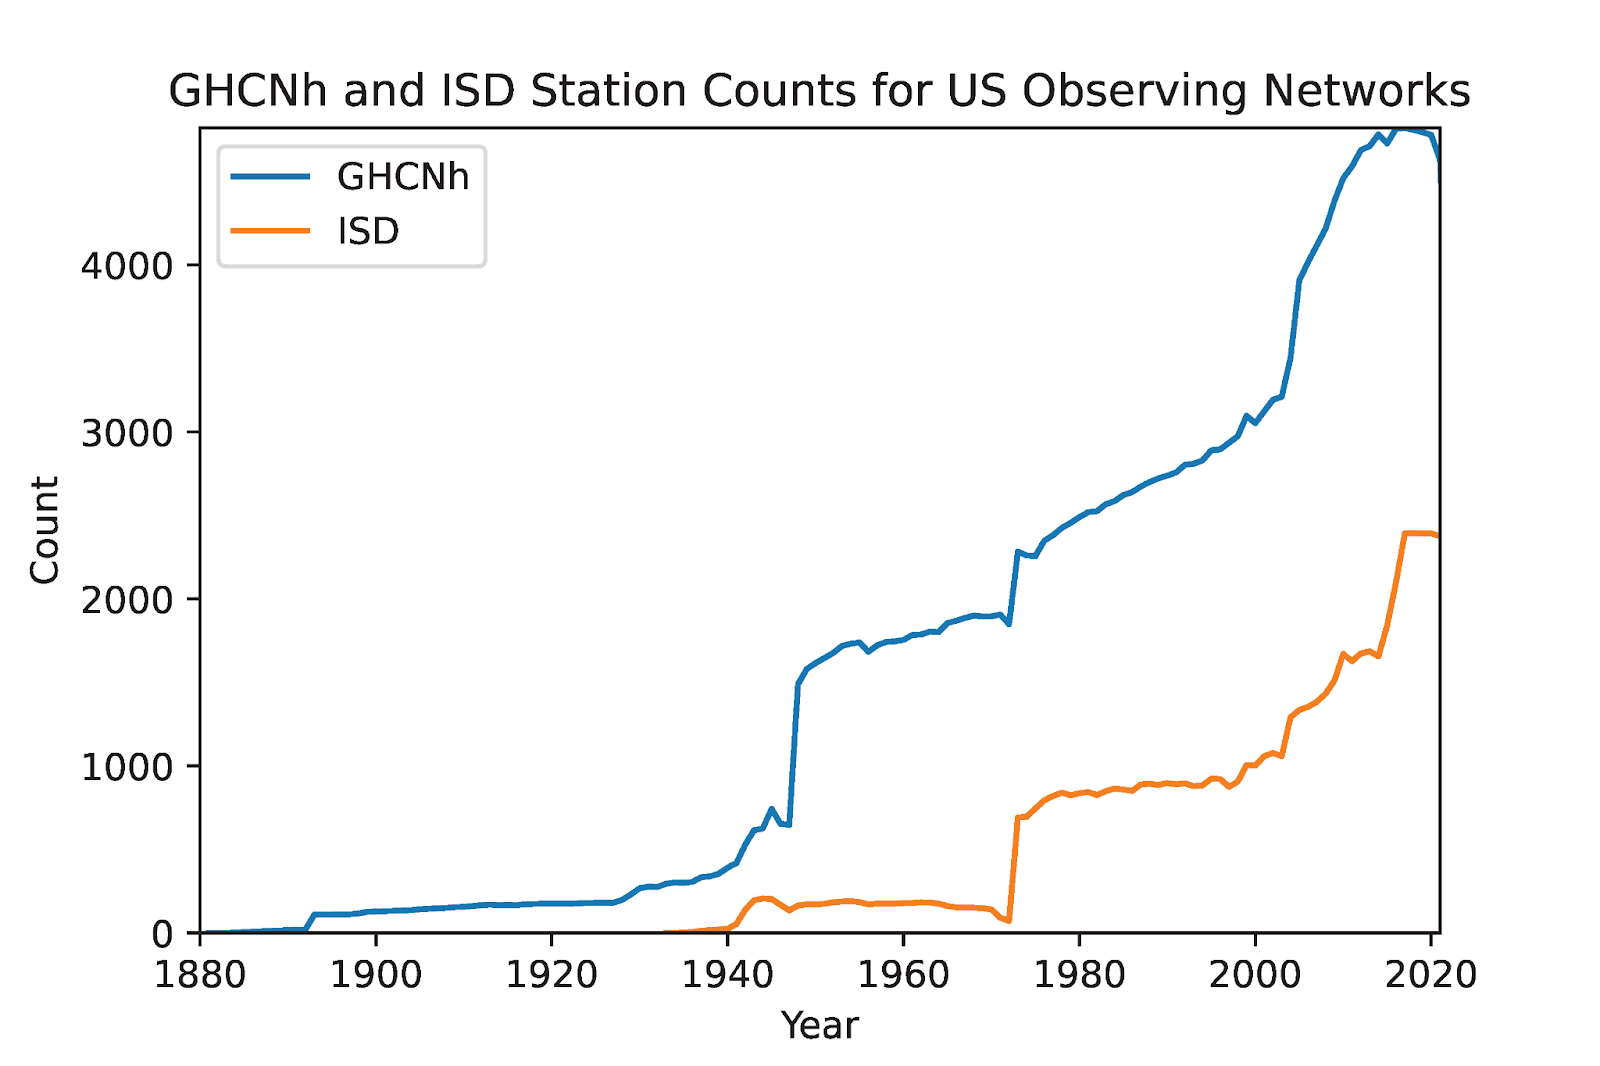
NCEI is excited to announce the release of the newest member of the GHCN suite of data products. The Global Historical Climatology Network hourly (GHCNh) is NCEI’s next generation hourly large-scale dataset composed of weather station observations worldwide, replacing the Integrated Surface Dataset (ISD), which has been provided since the early 2000s. The Local Climatological Data (LCD) product is also getting an update from version 1 to version 2, with hourly data derived from the GHCNh product. The transition to GHCNh from ISD/"Global Hourly" and Local Climatological Data (LCD) version 1 will occur gradually over the next month. Initially, only U.S. station-based data will be available, but the full global GHCNh will come online as the full transition is completed through May 2024.
The ISD and LCDv1 have been among NCEI’s flagship climate data products for decades for much of the weather and climate community, and the newly released GHCNh and LCDv2 will continue to serve this user community while providing several new benefits.
GHCNh incorporates the same set of data sources as ISD, plus more than 100 additional data sources. Some of these new sources provide observations for only a small number of stations, whereas others provided by larger-scale meteorological observation networks provide data for hundreds or even thousands of stations. GHCNh also covers a longer time period than ISD, including making available recovered data from the late 19th and early 20th century. Finally, GHCNh provides data keyed under the Climate Data Modernization Program (CDMP), extending data records in GHCNh (compared to ISD) for many stations in the U.S.
What Data is Included in the GHCNh?
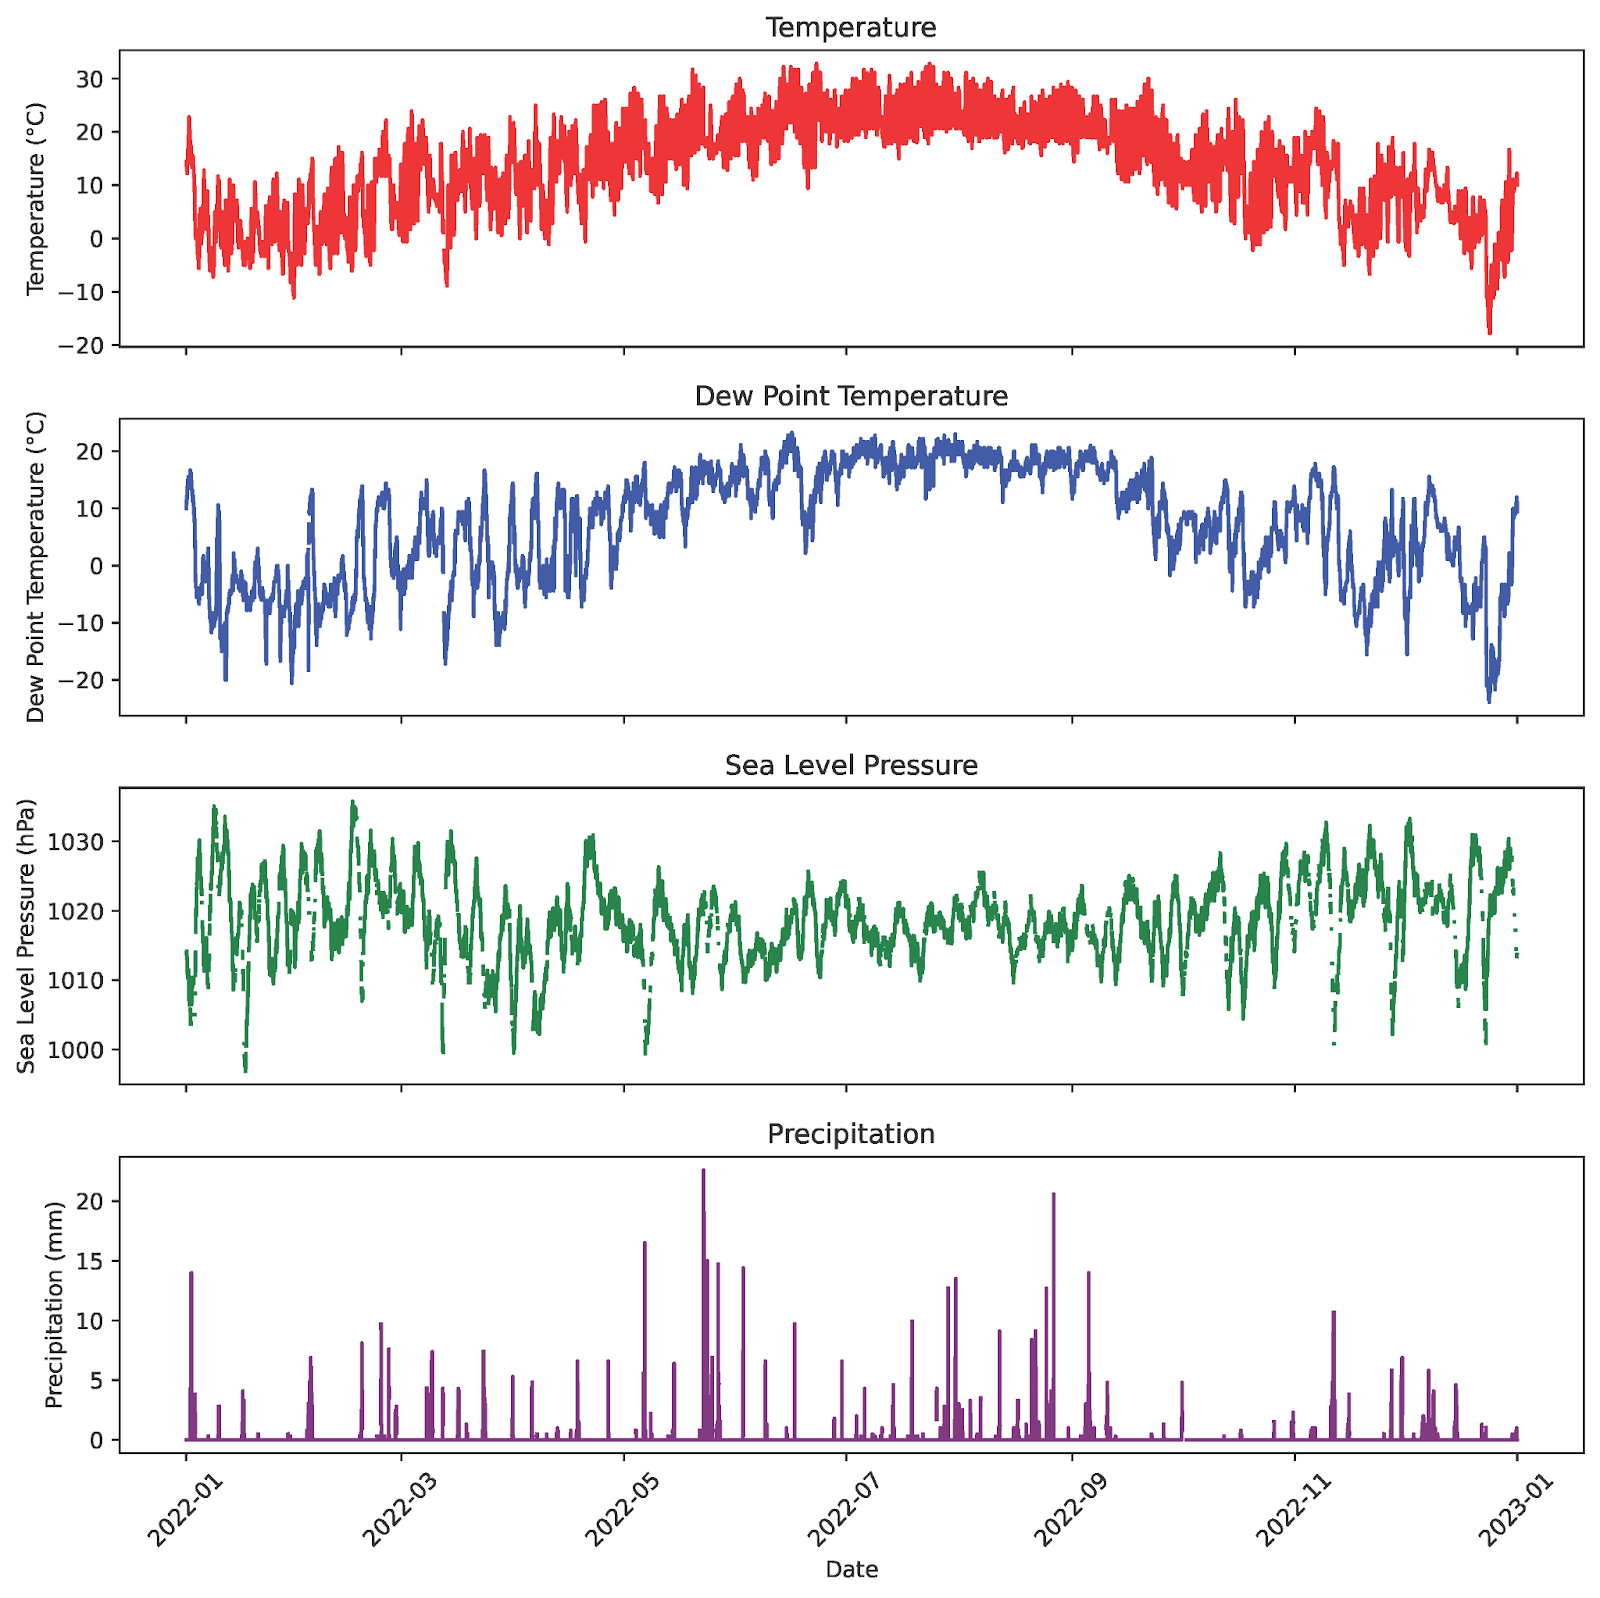
The data come from a variety of sources, both national and international. Not all data sources provide exactly the same data. Some sources contain observations for only one to a few meteorological elements whereas others are much more comprehensive. These elements include:
- wind speed and direction and wind gust
- temperature
- dew point and/or wet bulb temperature
- relative humidity
- cloud coverage data
- sea level and station level pressure
- altimeter setting
- present weather
- visibility
- precipitation amounts for various time periods
- snow depth
A complete list of data sources and parameter definitions for users can be found in the GHCNh documentation.
History of the GHCNh
GHCNh was developed as part of a collaboration with the European Union’s Copernicus Programme and specifically with partners at Maynooth University with the aim to make historical land and marine surface weather data more easily accessible worldwide. At NCEI, GHCNh was developed to be vertically aligned with its GHCN daily counterpart (GHCNd). This means that the same identifiers are used for stations common to the daily and hourly datasets and these identifiers are managed and searchable in NCEI’s Historical Observing Metadata Repository (HOMR) database and NCEI’s Data Access applications.
Integrating with Other NCEI Climate Data Projects
One of the most important factors in moving to GHCNh is the better alignment it provides with other core climate data products provided by NCEI, including GHCN daily (GHCNd). The common set of station identifiers used for stations in both GHCNh and GHCNd streamlines the management of these stations and station data. This also allows Local Climatological Data Version 2 (LCDv2) to be built on the GHCN source data, again better integrating NCEI climate data products. This makes user data access easier, creates consistency between NCEI data products, and also allows for easier use of the data for research and monitoring purposes.
NCEI’s former Global Summary of the Day product, now known as the Synoptic Summary of the Day (SSOD), will also be built on GHCNh data. For non-US stations, the name SSOD reflects the fact that it is built from synoptic reports and linked to a UTC calendar day rather than to local time and climatological day as defined by various global meteorological services. SSOD will be available through the NCEI Common Access User Interface and GIS systems.
Other benefits to better-aligned datasets include the ability to expand data holdings and partnerships. The format of GHCNh is more user-friendly, and gives users a clearer understanding of the raw data input sources, or where exactly the data is coming from. With these newer, better-integrated datasets, the process of addressing data bugs and issues that may arise is also more streamlined, allowing for better and faster response to customer needs.


